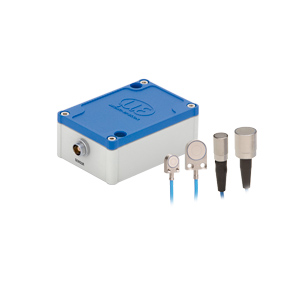
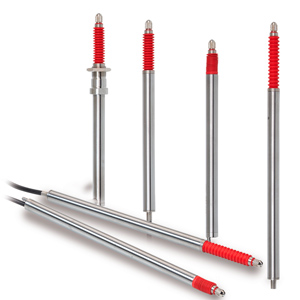


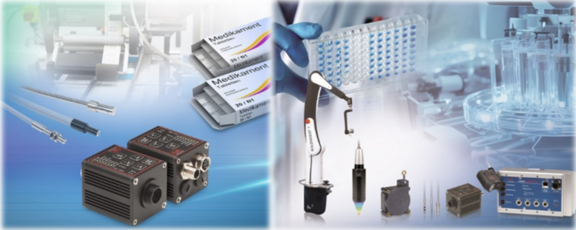
The highest standards of quality and repeatability apply in medical and pharmaceutical technology. This applies to medical equipment and apparatus, as well as in the development and production of pharmaceuticals, where high performance sensors are…
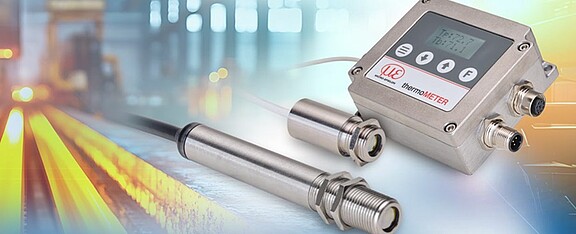
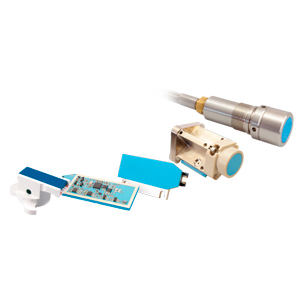
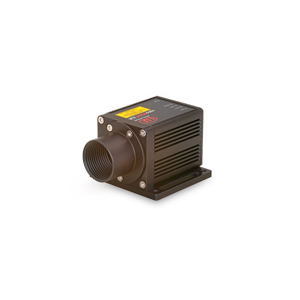
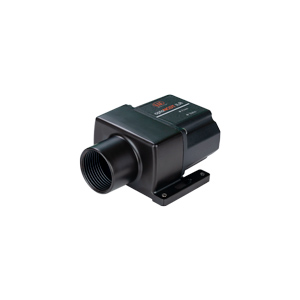
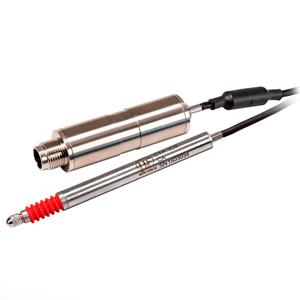
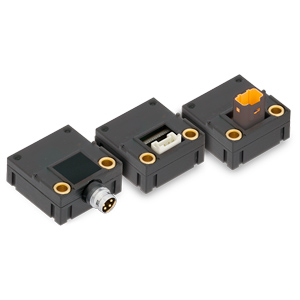
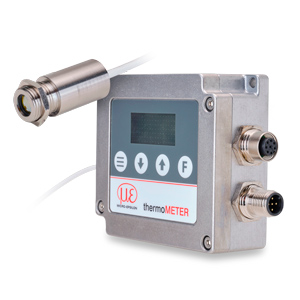
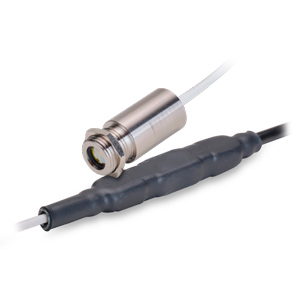
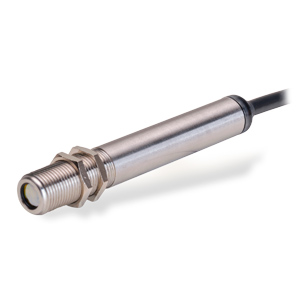
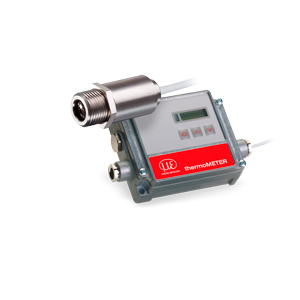
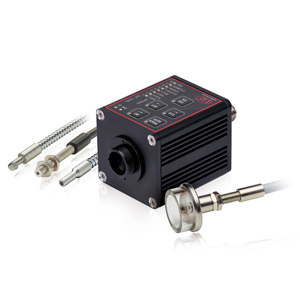
Precision sensor supplier Micro-Epsilon has launched a new portfolio of 100% in-house developed non-contact infrared temperature sensors (pyrometers). The new portfolio represents a total refresh of 20+ year technology and consists of three core…
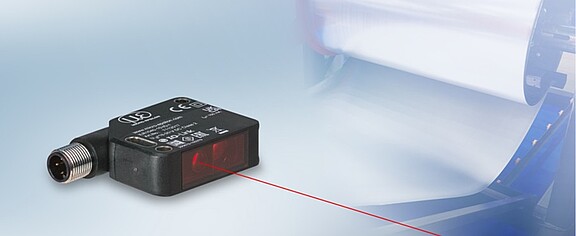
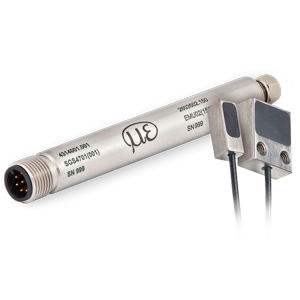
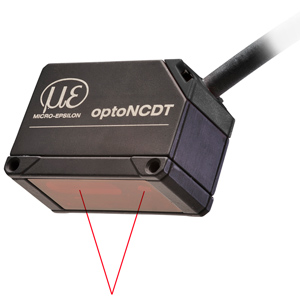
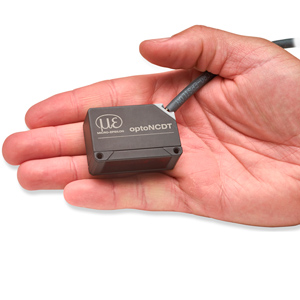
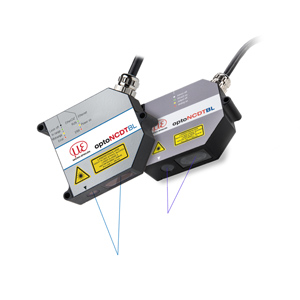
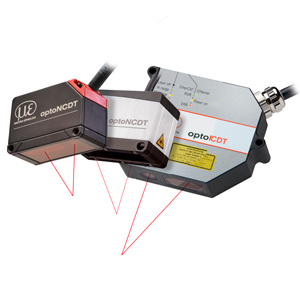
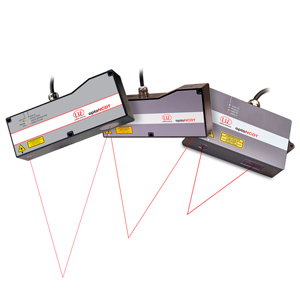
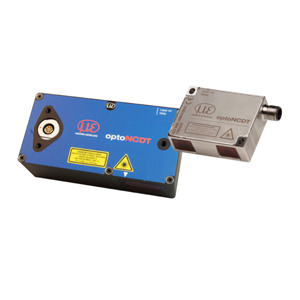
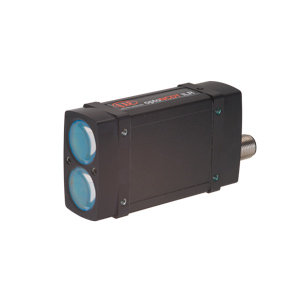
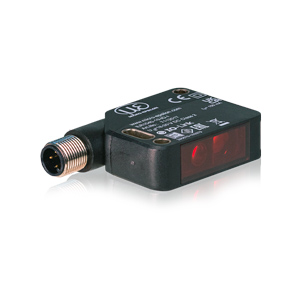
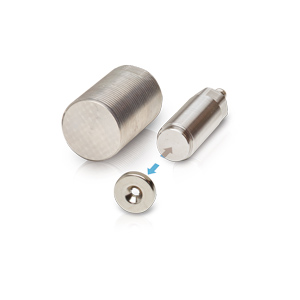
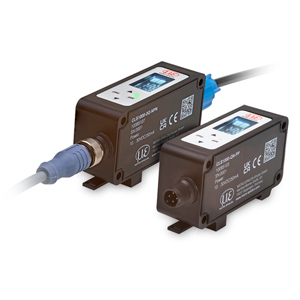
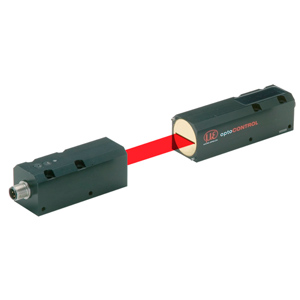
Precision sensor supplier Micro-Epsilon has extended its non-contact laser distance sensor portfolio with a low cost unit that is even more robust and compact than its predecessor measuring distances up to 60 m with a resolution of 1 mm and is…
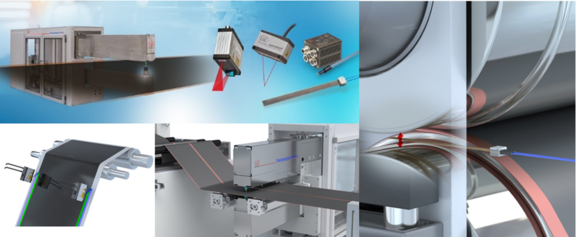
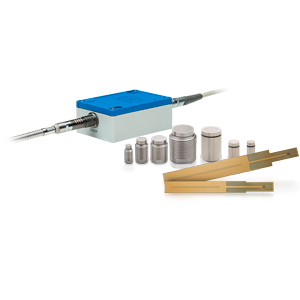
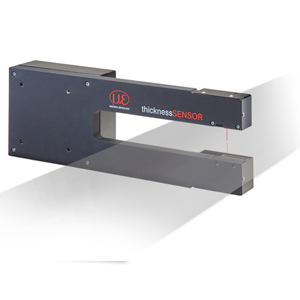
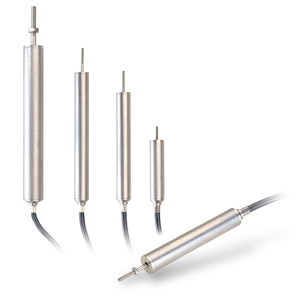
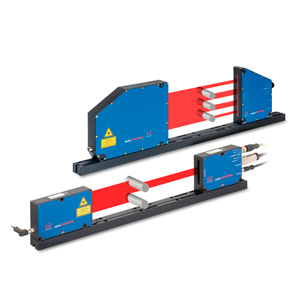
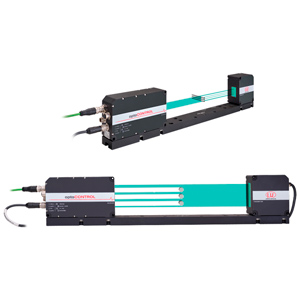
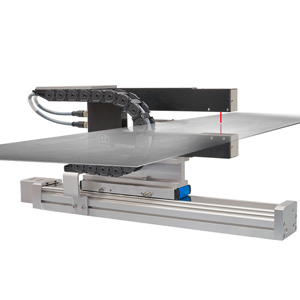
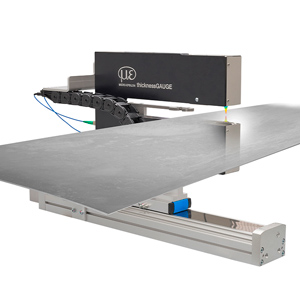
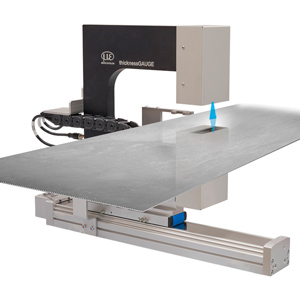
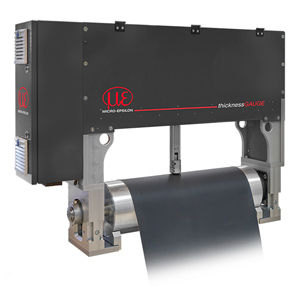
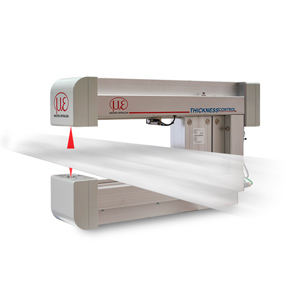
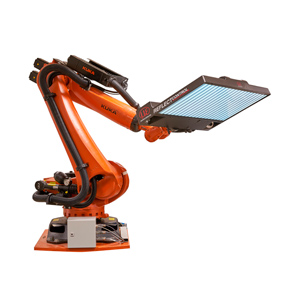
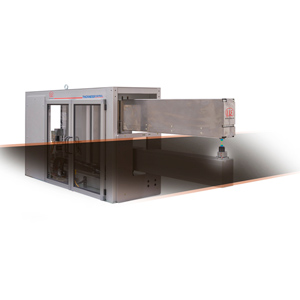
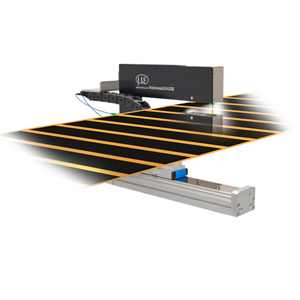
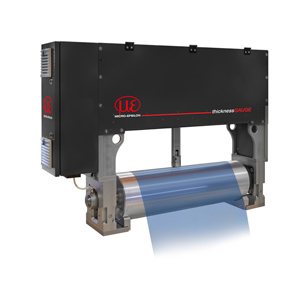
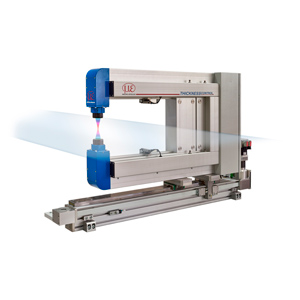
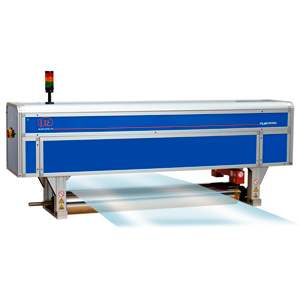
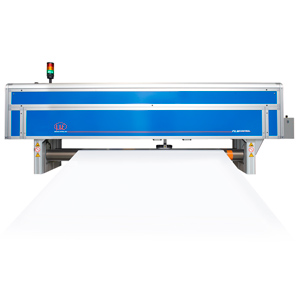
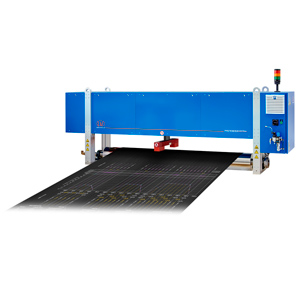
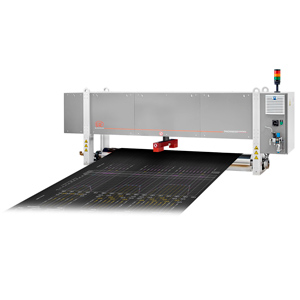
In battery production, high precision is essential to meet the high quality and performance requirements. Battery manufacturers are using inline thickness measurement systems, machine monitoring and 3D surface inspection systems to optimise processes…